Revised 15 January 2021

Acknowledgements
This report has been prepared with the financial support of the City of Toronto Department of Economic Development and six downtown Toronto Business Improvement Areas:
Bloor-Yorkville BIA
Downtown Yonge BIA
Toronto Entertainment District BIA.
St. Lawrence Market Neighbourhood BIA
Toronto Financial District BIA
Waterfront BIA
SRRA has benefitted from the review and input of its partners. Particular thanks are extended to Briar de Lange, Pauline Larsen, Janice Solomon, Tim Kocur, Mark Garner, Al Smith and Grant Humes.
SRRA is extremely grateful for the assistance of the City of Toronto's City Planning Division which conducts the Toronto Employment Survey and especially the tremendous work and support provided by Celine Foreht and Michael Wright.
Classification categories and their assignment have been undertaken by SRRA. All analysis, conclusions and research has been undertaken by SRRA, which is solely responsible for any errors or omissions.
This report was prepared by the SRRA team:
Stephen Johnson
Glenn Miller
Iain Dobson
Hayley Shortly
Contents
2.0 The pre-COVID Economy of Downtown Toronto Drove Wealth Creation in Ontario…
5.2 Part 2: What is the risk for the downtown as a residential community?................…..
6.1 Downtown BIAs by Major Economic Activity – Jobs ........….................................……
BIAs by Time Risk & Activity Toronto Entertainment District .....................................……
Downtown BIAs by Time Risk & Activity St. Lawrence Market Neighbourhood…......…...
Downtown BIAs by Time Risk & Activity Waterfront............................……..................…..
Tables and Charts 2.0 The pre-COVID Economy of Downtown Toronto Drove Wealth Creation in Ontario…

Executive Summary & Overview of Key Findings
In August 2020, six downtown Toronto BIAs and the City of Toronto engaged SRRA to benchmark and track progress towards the return to work in office employment in downtown Toronto. SRRA was tasked with providing three deliverables:
A review of best practices in London, Paris, Frankfurt and New York to identify effective approaches to communications, problem-solving and steps taken to mitigate the impacts of COVID on office occupancy was delivered in September with updates provided monthly.
An Occupancy Index that provides a highly accurate estimate of the percentage of office employees returning to work in downtown offices has been delivered monthly since September. To our knowledge, the Occupancy Index is the only data-driven survey of its kind being undertaken in commercial real estate circles anywhere in the world.
The third deliverable is this report on the economic and social impact of COVID on the downtown economy. This examines the risks both to downtown employment and the downtown residential community.
By almost any measure, downtown Toronto qualifies as the single most important real estate in Canada. Although downtown occupies less than three percent of the City’s land area, the assessed value of real estate accounts for about 25% of all revenues from property tax.

Forty percent of all jobs in the City are located downtown, as well as 30% of part-time jobs. From the perspective of contribution to GDP, 40% of the City’s wealth is generated in only 20% of all establishments, many of which represent the City’s largest employers.
The downtown economy is well suited, at the aggregate level, to survive COVID related restrictions. This, however, can obscure the significant risk to many employees and businesses. It is equally true that the downtown economy’s structure and diversified nature mean it is very well situated to not only survive but thrive. It is important to note that the challenges faced in Toronto are the same as those faced by our international competitors. Managing recovery will see changes at the individual level but the long-term prospects for Toronto remains strong.
The downtown is an urban experience destination with many diverse and fast-growing residential communities. With just over 273,000 residents, Downtown Toronto now accounts for over 9% of the City’s population and has grown three times faster than the rest of the City since 2014, with downtown growth expected to be 2.25 greater than the rest of the City through 2024.
Just under two-thirds of the nearly 155,000 households downtown live in rental units. Economic pressures and the unique demographics of the downtown population combined suggest that more than one-third of these households may face economic pressures in the medium term that could lead to re-location out of the Downtown.
The reputational risk faced downtown is perhaps the most easily addressed and also the risk with the greatest potential for long-term damage. The attractiveness of the downtown is significantly related to the amenities and activities that are available. Areas such as the Bloor- Yorkville BIA, Entertainment BIA, Downtown Yonge BIA and the Waterfront BIA are “live, work, play, learn, and shop” neighbourhoods. The very activities that have made these destinations attractive, however, are now profoundly undermined by the restrictions required by COVID.
Cultural activities, hospitality and the tourism sectors are important attributes of the fabric of these neighbourhoods and critical to their reputational attractiveness. This vibrancy also feeds into the attractiveness and desirability to base corporate HQs in the Financial District BIA.
SRRA’s analysis concludes there are 10 main findings:
#1 Impact of sustained COVID related shutdowns on GDP
The estimated GDP loss in downtown is almost half that for the City as a whole.
More than half – 56% -- of Toronto’s GDP is accounted for by wealth-creating and institutional activities. These are disproportionately located downtown. Although the City’s GDP in a worst- case scenario may be expected to decline by almost 20% as a result of on-going COVID-related restrictions, the vast majority of jobs in the wealth-creating and institutional sectors that are the foundation of the downtown economy are not at risk. The types of jobs in these activities are generally salaried, higher paying and more insulated from COVID restrictions than many jobs in the rest of the City.

#2 K-shaped recession and recovery: 123,00 jobs at risk
Downtown Toronto perfectly represents the parameters of a K-shaped recession, which places the burden the economic downturn as well as the subsequent drawn- out recovery on the shoulders of the lowest paid workers. In a pandemic in which the ability to work remotely is a key to economic and health outcomes the result is stark.
Almost 70% of jobs in the downtown can reasonably be performed remotely on an on-going basis. Using total compensation as a proxy for economic impact it can also be seen that these jobs account for almost 80% of the economic activity generated by the downtown.

The problem, however, is the more than 30% of jobs rated as “Low” and “No” that cannot be performed remotely on an on-going basis. These total more than 190,000 jobs.
Almost 70,000 of these jobs are Institutional and are largely concentrated in health sciences, meaning the risk of these jobs disappearing is very low.
The balance of more than 120,000 jobs, however, are largely dependent for their survival on a return to “normal”. In total, more than 6,750 establishments – almost 43% of all establishments downtown – are at risk and these account for almost 9% of all businesses in the City.
Combined, these jobs are in activities that, prior to COVID, contributed approximately $6.0 billion to Toronto’s estimated GDP and provided more than $3.65 billion in compensation to workers involved.

#3 Importance of Demand Suppression
Prior to the COVID-related restrictions implemented in March, 2020, more than 456,000 persons employed in the downtown area commuted daily from outside the downtown area. Along with the 273,000 regular residents of downtown, the 28 million tourists who visit each year, and the 245,000 students in regular and continuing education programs at institutions downtown, employees from outside downtown account for almost 40% of the regular base of potential daily consumers.
The necessary decision to close the border with the U.S. and a slew of additional restrictions on travel then caused a hard stop to virtually all tourism and business travel, which in normal times amounted to 28M visits annually, affecting hotels, restaurants and other businesses dependent on conventions and related activities. With tourism effectively on hold for the duration of the pandemic, 41% to 45% of the pre-pandemic baseline demand for goods and services downtown has been removed. Travel from within the City to downtown for leisure and shopping activities has also been greatly reduced.
The loss of both the physical presence in terms of foot traffic and physical spending on goods, food and drink etc. by so many tourists, students and non-resident workers underscores how critically important these customers are to the viability and character of downtown.
The result of these impacts is what economists refer to as a “demand-led recession,” where the sources of demand have been eliminated. Not only is this unfamiliar territory for governments more familiar with supply-side recessions, this COVID-inspired recession is not felt equally across different sectors of the economy.
#4 Medium Term is Critical: Risk to 40% of Jobs & GDP
Almost $4 billion in GDP and almost 81,000 jobs have either been effectively shut down already or are poorly suited to survive the 2nd Wave extended lock down and/or a complete closing of the border. Although these activities only account for 5.5% of the downtown’s total GDP they account for more than 25% of the establishments downtown and almost 15% of all jobs.

Policy choices made by the federal and provincial governments, the U.S. and internationally will have a significant effect on medium-term economic impacts. As presently configured, government programs are sufficient to support basic consumption by individuals and provide relief for recurring expenses for a range of businesses. These programs will provide a floor to demand and will help avoid the erosion of demand over the short-term from now through to Spring, 2021. More concerning, however, is that these supports will not be sufficient to sustain demand over the medium or even the longer term. Unlike previous recessions, the COVID recession is the result of ‘demand suppression,’ or, for some industries, ‘demand elimination.’
Particular Risk to Small Business and Non-Government Organizations
The immediate and medium-term risk is greatest to small businesses. The Canadian Federation of Independent Businesses (CFIB) reported in November 2020 that 51% of respondents to their survey noted permanent closure within 1 year was likely based on current demand and revenue drops. More than half -- 56% -- said that surviving the second wave will be a challenge.
The longer this demand reduction persist, the greater the risk. SRRA estimates more than 225,000 jobs, in addition to the nearly 81,000 now in peril, may face significant challenges over the medium term. It is this medium-term risk that is the most challenging representing almost $30 billion in GDP and more than 40% of all downtown employment.
Thirty percent of NGOs have had to lay off staff, totalling about 3,000 jobs. Some 20% report that, without specific financial supports, they will close permanently within six months.
In Toronto nearly 50% of NGOs indicate that will only be able to remain operational for one year under current conditions.
#5 Economic Pressure on Residential Population: Younger workers, those in the ‘gig’ economy and students
There are 50,288 downtown residents who hold jobs in economic activities that can be considered to be at high risk to being impacted by COVID-related restrictions. This accounts for almost 28% of the employed downtown labour force. This does not account t for those engaged in the informal or “gig” economy.
Prior to the pandemic the Bank of Canada concluded that including this sector would increase labour force participation rates by 2-3%. In downtown Toronto this would mean 5,000 to 7,500 people but probably higher given the fact that younger workers are over-represented in the gig economy and are a larger share of the downtown population.
Some with these economically at-risk jobs, especially those with part time jobs, will also be students. SRRA estimates this number to be approximately 30,000 or 20% of all downtown households. How these people will act in a world of on-line schooling without the need to be located near classes and the elimination or severe reduction of the attractions and amenities of downtown is unknown.
These three parts of the downtown population total between 50,000 and 90,000. Allowing for overlaps among the groups it is concluded that as many as 70,000 downtown residents face economic pressures that may lead to their relocation over the medium term.
#6 Raison d’etre for many to live downtown linked to a lifestyle snuffed out by COVID is leading to softening of condo-based rental market
COVID-driven changes to the downtown population are not just economic in nature. Many residents will have jobs in downtown jobs that are relatively insulated from COVID-related changes. For an unknown number of these residents the “choice” to leave downtown will be related not just to affordability concerns but also to perceptions of the desirability and attractiveness of downtown. Just under two-thirds of the nearly 155,000 households downtown live in rental units. At least annually, residents have the opportunity to relocate.
When assessing the risk that residents may choose to leave downtown it is important to note that Toronto’s downtown residents have a demographic profile that differs significantly from that of the rest of the city. As shown by demographic statistics, the downtown is in many respects very different from the rest of Toronto.
Downtown residents are younger, with 42% between the ages of 20 and 34
43% of households are headed by someone under 35
65% of downtown households are either single (i.e. not married) or are living with room
mates
63% have changed homes in a five-year period.
Taken together, these demographic realities show that the downtown population is more susceptible to change than the rest of the City. SRRA estimates this number to be approximately 30,000 downtown households.
Combined with residents facing economic pressures it is concluded that as many as 100,000 households may be at risk in the medium term. Mobility may be the underlying issue to most closely follow. TREB reports increased availability and average rents are also falling. The impact that the addition of over 45,000 condo units over the next 18 months may have on the supply and demand market for rentals is an issue to track as an indicator of the downtown’s return.
#7 Downtown Toronto’s attractiveness as a destination for business travel, domestic and international tourism could be at long-term risk if current conditions persist
The attractiveness of the downtown is significantly related to the amenities and activities that are available. The very activities that have made downtown destinations attractive, however, are now profoundly undermined by the restrictions required by COVID. Cultural activities, hospitality and the tourism sectors are important attributes of the fabric of downtown. This vibrancy also feeds into the desirability to base corporate HQs in the Financial District BIA.
An additional risk to the reputational attractiveness of the downtown is the increasing focus on pre-existing social inequities that have become more obvious and pronounced during the COVID pandemic. Some areas of downtown are reporting increases in petty crime and calls to 911. BIA managers have expressed concerns for the City’s reputation as a safe, clean place to shop, live and visit. Greater indicators of inequality and an emergent erosion of social cohesion are seen by many as people experiencing homelessness and those in precarious economic situations are more prominent.
Many observers suggest these inequities have increased and anecdotal evidence of increased substance abuse and vagrancy has added a new challenge for residents, the BIAs and their member businesses. In many respects what has always been present is now more visible as the masses of people – workers, students and tourists – who once dominated city streets day and night are now no longer present. In their absence, the most marginalized remain. Reports of greater reluctance to go downtown at night is an early indicator of this reputational risk.
All of these social variables add to the economic considerations faced by current and prospective residents of downtown neighbourhoods. As downtown confronts COVID it is clear that the centripetal forces that have been foundational to the area’s growth and attractiveness are profoundly compromised, while the centrifugal forces are both more apparent and growing. This combination creates a near perfect storm that challenges profoundly the short and medium-term viability of many downtown residential areas. i
#8 Manageable Risks to Government Revenues
The City’s 2021 Operating Budget assumes an operating risk of $1.5 billion which includes decreased revenues and increased costs. In 2013 the Downtown accounted for 25% of the property tax assessment and this share has undoubtedly grown as downtown growth has exceeded the rest of the City.
Commercial and retail property in downtown is predominantly owned directly or through subsidiaries by large institutional investors primarily in the form of large pension funds. With stable portfolios and very long investment horizons these are in many respects the ideal owners for commercial real estate during a pandemic.
The City’s revenue base is not as exposed to economic downturn as the tax base shared by the federal and provincial governments which will see declining sales tax and income tax revenues that are not subject to City taxation. The biggest revenue challenge confronting the City is transit fares which should prudently be assumed to experience a 50% reduction -- $600 million – annual challenge through the medium term.
Assuming a $7.8 billion GDP reduction the assumed annual Provincial revenue loss would be approximately $1.1 billion in foregone tax revenues from all source and the Federal
loss would be approximately $1.6 billion in foregone tax revenues from all sources. This risk would increase over the medium term.
#9 Loss of TTC revenue is City’s principal fiscal challenge
The massive scale of revenue shortfalls experienced by the TTC will have a detrimental impact on the City of Toronto’s budget priorities for 2021, and the agency will be challenged to maintain current levels of service as a result of $660M shortfall in 2020.
Within Toronto, the subway (and to a lesser extent the surface streetcar routes) has traditionally been the main transit delivery source for downtown. Prior to the onset of the second wave of infections, total TTC ridership had returned to 35% to 40% of its pre-COVID levels.
This, however, was largely been focused on surface bus routes. Subway usage remains historically depressed, a trend that will no doubt be exacerbated by restrictions on access to non-essential businesses imposed as a result of the second wave of infections.
A key contributor to the success of downtown is its walkability and access to multiple amenities made possible by a compact, dense urban fabric. This only works because transit is able to deliver the bulk of daily visitors.
Transit in the Toronto area relies upon the fare box to an extent that far exceeds norms in other jurisdictions. The collapse in transit ridership has caused municipal transit operating budgets to crater. Prior to the pandemic, almost 117,000 commuters from the regions around Toronto used transit, mostly GO, to access Toronto, with many of these going to downtown destinations near the Union Station terminus of the GO rail service. This ridership has not yet returned. Metrolinx reports that ridership for April through September was down by 92.4%.
#10 Restoring consumer confidence is key to resurgence
Impacts on those activities that support the larger economy (administrative, management and professional services) can be expected to assume new configurations. If the period of remote working extends for a sustained period of time it is inevitable that some changes made on a temporary basis may become permanent. Clustered in “white collar” activities, it is unlikely that job losses will be permanent but it is likely that the relocation of a portion of these away from the downtown will occur.
During the sustained lockdown in the spring of 2020, government programs provided unemployed and under-employed Canadians with sufficient support for basic consumption but were not enough to allow for discretionary spending. In addition, as restrictions were scaled back the combination of actual and perceived health risks encouraged many to avoid in-person shopping wherever possible, underscoring the importance of psychological and perceptual considerations as critical drivers of consumer confidence. Regardless of formal restrictions, these personal decisions will continue to play a determinative role for many consumers, especially when access to retail requires the use of transit which is still viewed with suspicion by many.
Toronto’s Diversified Post-Industrial Economy is Resilient
Although an economic analysis addresses each strand of the economy separately, the reality is that downtown represents an entire cultural and socio-economic ecosystem. Calculating Toronto’s attractiveness as a destination for business travel, domestic and international tourism cannot realistically be done without viewing the amenities of downtown holistically.
With its unique blend of large-scale wealth-creating office-based and institutional employment, a growing residential population and its extensive range of cultural, entertainment and institutional assets, Downtown Toronto’s many attributes that made it prosper before COVID also mean it is well-placed to recover from the pandemic. The fundamentals remain intact but key sectors are vulnerable.
Long after COVID becomes a well managed public health matter, Toronto’s downtown will continue to be diverse, attractive to newcomers and provide the kind of concentration of opportunities in finance, health, post-secondary education, technology and culture that helped establish the City’s reputation for an enviable quality of life.
This report has outlined and sought to quantify the economic costs for the downtown created by the COVID pandemic. As detailed herein these costs are significant and the risks are especially shouldered by the lowest paid employees and small businesses. At a human level there has been and will be real pain for far too many.
It is equally true that the downtown economy’s structure and diversified nature mean it is very well situated to not only survive but thrive. It is important to note that the challenges faced in Toronto are the same as those faced by our international competitors. Managing recovery will see changes at the individual level but the long-term prospects for Toronto retail, tourism and other sectors challenged in the short term remains strong.
All of the factors that made downtown Toronto a desirable place to live and work prior to COVID will continue to be present as we manage COVID related challenges and long after COVID is either eliminated or managed as an endemic challenge within acceptable Public Health parameters.
1.0 Introduction
In August 2020, six downtown Toronto BIAs (Downtown Yonge BIA, Toronto Financial District BIA, St. Lawrence Market Neighbourhood BIA, Waterfront BIA, Bloor-Yorkville BIA, and the Toronto Entertainment District BIA) and the City of Toronto engaged SRRA to benchmark and track progress towards the return to work in office employment in downtown Toronto.
Project Deliverables
SRRA was tasked with providing three deliverables:
A review of best practices in London, Paris, Frankfurt and New York to identify effective approaches to communications, problem-solving and steps taken to mitigate the impacts of COVID on office occupancy. We delivered the first report in September. Updates are provided as and when new information becomes available.
An Occupancy Index that provides a highly accurate estimate of the percentage of office employees returning to work in downtown offices. The Occupancy Index is based on confidential direct reports from a broad cross-section of landlords and tenants as well as in-depth interviews with a representative sample of companies located in all building types.
To our knowledge, the Occupancy Index is the only data-driven survey of its kind being undertaken in commercial real estate circles anywhere in the world. Its efficacy depends on a rigorous methodology and benefits from on-going commitment from landlords and tenants.
The third deliverable is this report on the economic and social impact of COVID on the downtown economy. This examines the risks both to downtown employment and the downtown residential community.
The goal of SRRA’s work is to provide public and private decision makers, landlords, tenants, their employees and transit operators with data-driven insights to assist decision-making and help inform plans to safely return workers to the downtown core.
The Importance of Office and Institutional Employment
Employment in the downtown is overwhelmingly located in Office and Institutional settings, accounting for 80% of downtown jobs.
Tracking the return to these types of employment locations provides the best means of measuring the pace and direction of the resumption of pre-COVID levels of possible economic activity.

The Challenge: A Demand Recession and the Immediate to Mid-Term Risk
The sudden shift to large scale remote working in March 2020 affected the commuting habits of more than 450,000 workers but the greatest impact was on those parts of the broader downtown economy reliant upon a robust and steady flow of customers.
The suppression, and in some cases complete elimination, of demand is the most salient factor to understand the unique economic impact of COVID. The recession that has followed is a “demand recession,” unlike other economic slow downs in the past which have largely been the result of disruptions to the supply side of the economy.
The impact of a demand recession is not equally felt across different sectors of the economy.
SRRA estimates that the immediate and medium-term risk to downtown employment totals more than 123,000 jobs. This represents more than 20% of downtown employment and almost 8% of all jobs in the City as a whole.
Combined, these jobs are in activities that, prior to COVID, contributed approximately $6.0 billion to Toronto’s estimated GDP and provided more than $3.65 billion in compensation to workers involved.
The negative impact of COVID is largely concentrated on small and medium businesses. In total, more than 6,750 establishments -- almost 43% of all establishments downtown -- are at risk and these account for almost 9% of all businesses in the City.

Outline and Scope of Report
The purpose of this study is to describe the economic and social impact of COVID-related restrictions and/or reductions on mobility and the flow of people into the downtown and the resulting impact on the economy resulting from the reduced consumer demand.
Section 2 of this report describes the pre-COVID economy of the downtown including the important role played by downtown residential communities.
Section 3 of this report provides an analytical framework for understanding the downtown economy. Economic activities are examined in terms of the function played within the larger eco-system of the downtown economy. Activities are further analyzed to assess the extent to which remote work is a viable long-term option. Finally, three different time-frame scenarios for analysis are described. These are:
Immediate to Short-term: Fall 2000 through March 2021;
Medium-term, March 2021 through to Fall, 2023; and
Longer-term, beyond Fall 2023.
Section 4 assesses the current state of the downtown economy at the outset of Wave 2 of the pandemic focussing on sectors known to be in immediate peril.
In Section 5 the study explores four sets of questions:
What is the risk to jobs?
What is the risk for the downtown as a residential community?
What are the fiscal risks to governments?
What are the macro economic risks beyond the control of decision makers?
2.0 The pre-COVID Economy of Downtown Toronto Drove Wealth Creation in Ontario
The Downtown Economy
Prior to the COVID-related restrictions implemented in March, 2020, more than 456,000 persons employed in the downtown area commuted daily from outside the downtown area. Along with the 273,000 regular residents of downtowni, the 28 million tourists who visit each yearii, and the 245,000 students in regular and continuing education programs at institutions downtown, employees from outside downtown account for almost 40% of the regular base of potential daily consumers.
These population groups collectively account for the baseline daily demand that sustains the service, retail, experiential and consumption economy of downtown. Many of these businesses are in low margin economic activities which rely upon volume and especially in-person interaction with customers.
With international tourism suspended, domestic tourism profoundly reduced, and most post- secondary and continuing education programs moved on-line, the importance of non-resident workers to the viability of the downtown economy is increased.

The economic value in terms of spending represented by each group is not known with certainty. Based on Statistics Canada dataiv it is estimated that residents of downtown spend $6.8 billion on normal consumption, excluding transportation and shelter costs. Tourism Toronto estimates the visitor economy contributed $6.7 billion in 2019 (with $1.35 billion – 20% -- from US tourists).
In 2014 a study of Ryerson University studentsvi suggested weekly spending per full-time student ranged from $10 to $59. Applying these estimates to the student population suggests an annual contribution of $230 million to $680 million.
For the purposes of this analysis it is assumed that workers commuting to downtown would have a spending profile comparable to the higher end of the Ryerson study of student spending. Assuming weekly spending per worker of $50 to $100 it is suggested that, in normal times, spending by non-resident workers adds $1.1 billion to $2.1 billion to the downtown economy each year.
Toronto residents from outside the downtown also account for a significant portion of the aggregate economic activity downtown. No estimate of this is made in this study which is focussed on the baseline demand provided by tourism (which is concentrated downtown) and those who live, study and work downtown.

With tourism effectively on hold for the duration of the pandemic, 41% to 45% of the pre- pandemic baseline demand for goods and services downtown has been removed. Travel from within the City to downtown for leisure and shopping activities has also been greatly reduced.
While downtown residents and non-resident workers and students cannot reasonably be expected to replace this demand, it is equally true that the continued physical presence and continued spending of non-resident workers and students is key to the downtown’s viability.

Downtown Employment
The importance of the downtown economy cannot be overstated.
As Toronto has evolved into a modern, diversified post-industrial economy, commercial office and institutional-based employment has driven job growth. This shift has been more marked by the fact that contemporary industrial and manufacturing activities have become less labour intensive. Today, the downtown accounts for 40% of all full-time jobs in the City and 30% of part-time jobs.

The downtown attracts more than 25% of new establishments each year and since 2014 almost 55% of Toronto’s job growth has been downtown. The City of Toronto estimatesvii that five-year average employment growth in downtown has been 4.2%, which is double the rate in designated employment areas and five times that in City’s four designated Centres.
Toronto’s Financial District is the second largest in North America behind New York and it is the third largest concentration of downtown commercial space after New York and Chicago.
Toronto’s creative industries have made Toronto the 3rd largest location for live entertainment in the English-speaking word behind London and New York. Broadcasting, telecommunications, and film, TV and video game production and software publishing have become major contributors to Toronto’s economy, adding almost $5 billion to the GDP of Downtown Toronto.
Toronto is Canada’s main tourist destination, attracting more than 4.52 million international tourists annually, with most tourism-related activity concentrated in the downtown.
City of Toronto plans envision continued job growth in the downtown to encourage agglomeration economics in both established activities (finance, real estate, business services, health sciences, post-secondary education, health sciences, government and justice) as well as newer activities (information technology, media and creative industries and destination tourism and retail.)
Current City of Toronto estimates project an increase of between 193,000 and 316,000 jobs in the downtown by 2041, with a planning assumption of 254,000 new jobs.viii This represents an assumed increase of more than 40% and will require more than 32 million square feet of new or repurposed office space based on pre-COVID norms regarding working space sizes and configurations. Mandates for larger spaces and more opportunities for safe distancing may very well serve to increase the required office space size.
Downtown Contribution to GDP
The economic importance of downtown is not only reflected by the total number of jobs that it supports. The economic value of these jobs is of critical importance because wealth-creating and institutional activities1, which are comparatively less impacted by COVID related restrictions, are over-represented in the economic sectors downtown.
Although downtown accounts for less than 40% of employment in the City, 48% of the jobs in Toronto’s wealth-creating sectors and 35% of those in institutional activities are located downtown. The 6 BIAs supporting this study account for almost 30% of these activities.

The downtown economy is also less reliant upon Consumption and Distribution activities, which are among those most at risk from an extended period of COVID-related mobility restrictions.

The importance of the downtown economy can be best seen by estimates of its contribution to the total GDP of Toronto. The downtown generates:
almost 40% of Toronto’s wealth,
20% of the wealth of the region,
10% of the wealth of the Province as a whole.

As shown below, Toronto’s downtown economy is larger than that of eight Canadian Provinces and Territories, and larger than the combined GDP of the three maritime provinces.

Downtown as a Residential Community
With just over 273,000 residents, Downtown Toronto now accounts for just over 9% of the City’s population. The downtown population has grown three times faster than the rest of the City since 2014, increasing by 16.7% (39,117 people) compared to growth of 5.5% (141,836) in the rest of the City. Planning assumptions project that this pattern will slow but downtown growth is expected to be 2.25 greater than that of the rest of the City through 2024.
For much of the past 20 years, Toronto has been in the grips of a condo building boom. Home to more construction cranes than any other city in North America, the City’s skyline has been transformed as a result of many variables but, especially, strong immigration and the desire of millennials and others to live downtown.
Just under two-thirds of the nearly 155,000 households downtown live in rental units. Condominium units have come to represent a critical element of rental supply accounting for most of the growth in rental stock.
In the downtown, condos represent more than 57% of households but less than 32% in the rest of the City. Almost half of condos downtown provide rental housing. Apartments account for 90% of downtown non-condominium households.
To accommodate planned residential growth most new rental accommodation downtown will continue to be in the form of condos. Over the next 18 months more than 45,000 new condo units across the city will come onto the market, most in downtown, and more than 50% of these are estimated to be rentals.ix
Reputational Risks
The attractiveness of the downtown, however, is significantly related to the amenities and activities that are available. Areas such as the Bloor-Yorkville BIA, the Toronto Entertainment District BIA, the Downtown Yonge BIA, the St. Lawrence Market Neighbourhood BIA and the Waterfront BIA are all “live, work, play, learn, and shop” neighbourhoods. The very activities that have made these destinations attractive, however, are now profoundly undermined by the restrictions required by COVID. Cultural activities, hospitality and the tourism sectors are important attributes of the fabric of these neighbourhoods and critical to their reputational attractiveness. This vibrancy also feeds into the attractiveness and desirability to base corporate HQs in the area covered by the Financial District BIA.
An additional risk to the reputational attractiveness of the downtown is the increasing focus on pre-existing social inequities that have become more obvious and pronounced during the COVID pandemic. Many observers suggest these inequities have increased and anecdotal evidence of increased substance abuse and vagrancy has added a new challenge for residents, the BIAs and their member businesses. The social challenges laid bare by COVID mean a new emphasis is needed downtown focused on the entire social infrastructure that must be dealt with to create a new-found sense of safety and security for both the employment base and visitors. The future attractiveness of conferences and conventions will be viewed through a new lens – namely the level of effectively supporting a social infrastructure around homelessness, addictions and mental health.
All of these social variables add to the economic considerations faced by current and prospective residents of downtown neighbourhoods. Questions being raised in the media include: “If there is no longer pressure to schmooze and put in face-time downtown then why
continue to pay exorbitant mortgages and/or cram yourself and your family into shoebox condos in the core in order to maintain a reasonable commuting time?” For industry’s talent-spotters, as well as thousands of younger workers, the reputation and opportunities available in Toronto are defined by the City’s social life, restaurants, sporting events, and everything that collectively adds to the cultural cachet.
Location decisions are driven by competing forces – those that are centripetal and attract people into the downtown, and those that are centrifugal and push people out of the downtown. At a strategic level, urban economic planning and advocacy need to mitigate the centrifugal forces and boost the centripetal ones in order to create a net positive, attractive effect and ensure that the downtown remains vibrant, occupied and economically successful.
As downtown confronts COVID it is clear that the centripetal forces that have been foundational to the area’s growth and attractiveness are profoundly compromised, while the centrifugal forces are both more apparent and growing. This combination creates a near perfect storm that challenges profoundly the short and medium-term viability of many downtown residential areas.
3.0 Data and Methodology: 3 measures for analysis
3.1 Data
The scope of the study benefits from five principal sources of data.
City Data
The City of Toronto Economic Development and Culture Division (EDC) maintains an active data set measuring GDP by NAICS classifications derived from Statistics Canada data. The City of Toronto's City Planning Division also conducts an annual Toronto Employment Survey that measures employment by location and by NAICS classification. These two data sets have been used to estimate GDP by activity and location across the City. There are limitations to merging two different data sets.
For example, the Toronto Employment Survey assigns the NAICS coding of Statistics Canada which includes some NAICS codes that are not used by the EDC Division data to estimate contribution to GDP. Wherever possible omissions such as this are addressed by aggregating comparable codes but this is an assumption-driven and imperfect process. The data maintained by the City tracks employment at a more detailed level. Further work by the City at this more detailed level could provide greater specificity as to sectors at risk and could inform targeted measures by the City and Province to support “at risk” employers and workers.2
The data collected by the Toronto Employment Survey is strictly confidential to maintain the City's commitment of confidentiality to the respondents to this voluntary survey and is released only in aggregated form to show employment patterns without revealing information on individual businesses.
The City Planning Division has aggregated Toronto Employment Survey information to maintain the confidentiality of the survey responses. Consistent with this, SRRA has further aggregated NAICS data for analytical purposes and also to ensure the confidentiality of data provided by the City.

Statistics Canada Data
Statistics Canada has estimated the extent to which work activities based on NAICS categories can reasonably be performed remotely. The approach outlined by Statistics Canadax has been adapted by SRRA to estimate by NAICS classification the scope for remote work in Toronto. The coding suggested by SRRA has then been merged with City of Toronto Employment survey data to allow for geographic-based estimates.
Statistics Canada also provides estimates of total compensation for NAICS codes for Ontario.xi These amounts have been used to estimate the total compensation generated by the jobs reported by the City of Toronto. For part-time employment the modelling assumes each part time job is equal to 50% of a full-time job.
Retail impact studies prepared before COVID for the downtown BIAs by Environics Research presenting Statistics Canada data about the residential population of the downtown has been used as the basis for analyses about the potential risks and impacts on the downtown population and local businesses.
3.2 Methodology: Classifying Economic Activity
To understand the economy of Toronto and the Downtown, SRRA has assigned every NAICS code with one of four Economic Activity Codes:
Wealth-Creating Activities
Service Activities
Institutional Activities
Consumption & Distribution Activities
Wealth-Creating Activities are defined as those that create products and services that are sold outside of the City (including those consumed by tourists) as well as activities such as Finance that serve a national or international market. Wealth is brought into the City as a result of these activities and/or their location in the City. At a fundamental level, these activities are the foundation for all other economic activity.
The major wealth-creating activities in downtown Toronto are:
Manufacturing of durable and non-durable goods for both local and export purposes
Tourism related activities including spectator sports and performing arts
Information and cultural activities such as software publishing, motion picture and TV
production
Financial and insurance services.
Service Activities are defined as those that support wealth-creating activities and those that provide services for the population at large. There are, of course, some services that have a wealth-creation element. Toronto’s high-end restaurants and retail arguably serve to attract spending to the City that would not otherwise occur.
Data is not sufficiently granular to allow for this when assigning code values. When classifying activities as ‘service’, the activity would not exist or cannot continue without the wealth-creating activities in the City. Similarly, the post-secondary education cluster in the downtown with three universities and George Brown College serves to attract and concentrate wealth in the downtown.
The major business service activities in downtown Toronto are:
Business-to-business electronic markets, and agents and brokers
Real estate and leasing services
Transportation and couriers
Data processing, hosting and support
Professional services
Management and administrative services.
Services that support business and non-business customers (such as tourists) include:
Accommodation services
Food services and drinking places
Repair and maintenance
Personal and laundry services.
Institutional Activities are those that are public services largely funded by the tax base. In addition, activities that rely upon pre-existing capital investments are also included. These utilities, transportation and telecom activities are similar to Services in that their cash flow depends on other economic activities. An argument can be made that telecommunications and Broadcasting are Wealth-Creating activities.
It also true that some publicly supported activities, especially those in health services and post- secondary education, have an element of wealth-creation as their existence serves to attract international students, international researchers and related revenues.
Major institutional activities in downtown consist of:
Utilities especially power generation, transmission and distribution
Water and waste management
Transportation and postal services
Broadcasting and telecom
Educational services which are 65% post-secondary downtown
Health care concentrated on the hospitals along University Avenue
Public administration especially provincial and municipal government
The non-profit and volunteer sector.
Consumption and Distribution Activities are those that provide consumer goods and services. The income earned by people in the other activities is the prerequisite for consumption. These are the most place-dependant activities and often those with the lowest paid workforces. These activities include:
Manufacturing of non-durable goods and wholesale trade
All retail activity
Warehousing, distribution and truck transportation.
Toronto’s Diversified Post-Industrial Economy is Resilient
More than 56% of Toronto’s GDP is attributable to Wealth Creating and Institutional activities. As detailed below, most of these are not at risk as a result of COVID-related restrictions to mobility.
In addition, services supporting business, (i.e. excluding accommodation and food) account for almost 31% of GDP, meaning approximately 86% of Toronto’s GDP is significantly insulated from adverse impacts due to COVID at least in the short to medium term.
The challenge of COVID, however, is that in reality the type of employment activity does not mirror an activity’s contribution to GDP. While Wealth-Creating and Institutional activities account for 56% of GDP (and employment income), they represent 51% of jobs.

The greatest divergence between employment and GDP is in the Consumption and Distribution sector, which accounts for 35% of employment (and employment income) but only 10% of GDP. This sector also represents almost 30% of all business establishments. These two facts explain the importance that policy makers assign to the sector in particular and small businesses in general.

As shown below, the downtown economy is very different from the rest of the City. Although it accounts for almost 50% of GDP in Wealth-Creating activities it does so with just over 20% of establishments.
Most striking is the fact that the majority of Consumption & Distribution activities are overwhelmingly outside of the downtown.

The main conclusion from the above is that the downtown economy contributes a disproportionate amount of wealth-creating activity for the City as a whole from a relatively small number of large employers. The types of jobs in these activities are generally salaried, higher paying and more insulated from COVID restrictions than many jobs in the rest of the City.
3.3 Methodology: Capacity for Remote Work
Central to understanding the challenge of COVID-related restrictions is an understanding of the extent to which economic activities can be performed remotely. Quantifying how many jobs and how much of GDP can be sustained remotely is necessary to understanding the pace with which employees can be expected to return to their normal places of work. It also serves to quantify the possible scope for long-term changes to the labour market and the nature and location of work.
According to Statistics Canadaxii, prior to the pandemic the percentage of employees usually doing any scheduled hours from home changed very little from 2000 to 2018 and varied from 10% to 11% from 2000 to 2008 and stood at about 13% in 2018. This finding is mirrored by SRRA’s work on the Occupancy Index that shows the pre-COVID normal occupancy downtown hovered around 78%, meaning 12% were away from the office on any given day.
Statistics Canada has modelled the ability to carry out remote work based upon NAICS codes informed by research from the U.S. which estimated that approximately 37% of jobs can be done from home in the United States.xiii Statistics Canada concluded that about 38.9% of Canadian workers are in jobs that can plausibly be done at home. This aligns almost perfectly with Statistics Canada’s March 2020 Perspectives Survey Series that found that 39.1% of workers were teleworking during the last full week of March during the first wave of lockdown.
Very significant variations based on gender, age and education exist as reported by Statistics Canada.

The potential implications of these demographic considerations are explored in section 5 below which examines the impact of sustained COVID restrictions on Toronto as a desirable downtown residential community. The reality is that Toronto’s downtown residents have a demographic profile that differs significantly from that of the rest of the city. Specifically, residents are younger and, as reflected by Statistics Canada analysis, thus less likely to hold jobs that can be performed remotely.
To understand the capacity for remote work on a regular, on-going basis SRRA has coded NAICS jobs. When assigning a classification SRRA has been informed by the criteria used by Statistics Canada.
Specifically, when considering the task content of an occupation it is assumed that an occupation cannot be performed at home if it meets at least one of the following criteria:
the need to perform work for or work directly with the public;
the need to work outdoors;
the need to operate or repair machinery and equipment;
the need to inspect equipment, structures or materials;
the need to wear common or specialized protective or safety equipment;
the need to handle or move objects; or perform general physical activities.
In the absence of these considerations an occupation is considered to be one that can be performed from home. Rather than the binary approach adopted by Statistics Canada, SRRA has assigned jobs in one of four ‘work remote’ categories.
Most comparable to the Statistics Canada approach is the code of “No” indicating a task cannot reasonably be performed remotely on an on-going basis. Closely related is the “Low” category which recognizes some jobs can be performed remotely for limited periods of time but not on an on-going basis.
At the other extreme are jobs coded as “High” which are those that can be performed remotely on a near indefinite basis. Jobs assigned a code of “Moderate” are those for which some element of regular office-based work is both necessary and desirable.
As documented in SRRA’s Occupancy Index, interviews with employers show that the fact a job can be done remotely does not mean it will be or indeed should be. Function is not destiny, especially for younger workers for whom “face time” is seen as a key aspect of mentoring and career advancement.
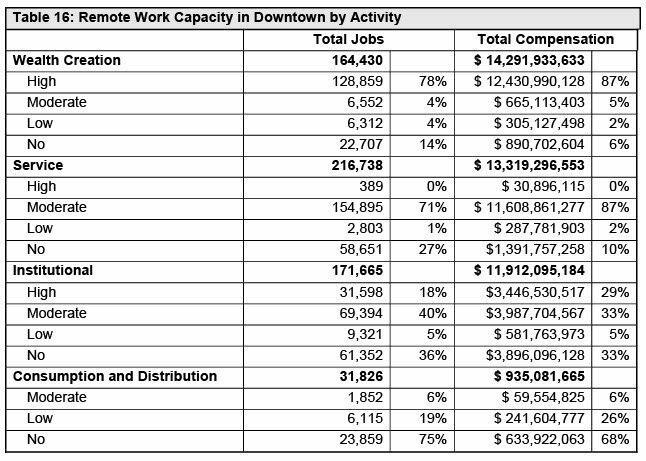
As shown below, almost 70% of jobs in the downtown can reasonably be performed remotely on an on-going basis. Using total compensation as a proxy for economic impact it can also be seen that these jobs account for almost 80% of the economic activity generated by the downtown.

The problem, however, is the 32% of jobs that cannot be performed remotely which total more than 190,000 jobs. If one assumes that those in Consumption and Distribution and Services are dependent for their survival on a return to “normal” it can be estimated that almost 91,500 jobs, representing almost $2.6 billion in compensation, are at immediate risk.
More than 90% of the downtown wealth-creating economy as measured by total compensation can be considered to be largely immune to place-based work constraints. The same is true for more than 87% of Service-related compensation.
While 33% of Institutional compensation is related to jobs that cannot be performed remotely, these are largely concentrated in health sciences, meaning the risk of these jobs disappearing is very low. In reality, health services can be expected to actually grow. As shown above, the risk is to those jobs largely concentrated in Service and Consumption and Distribution activities with a Low to No remote work rating.
3.4 Methodology: Time Frames for analysis
In assessing the economic and social impact of extended COVID-related restrictions and delayed return to regular workplaces the study examines the data from three perspectives:
Short-term, now through March 2021;
Medium-term, through to Fall, 2023 (best case assumptions for vaccinations)
Longer-term, beyond 2023 (best case for re-opening of the border with the U.S).
The short-term period carries through the end of the current fiscal year of the Federal and Provincial Governments. Supports to persons and businesses that may moderate the impact of COVID restrictions on the economy can be assumed to last at least through this period. It is also assumed that this period will in all probability see a second near total shutdown of many businesses during the mid-December 2020 through March period.
The medium-term extends through the Fall of 2023. Many analysts such as the Conference Board of Canada and major banks explicitly assume that an effective vaccine will be available and distributed by June of 2021. This author believes this to be an optimistic timeframe.
The date of Fall 2023 is suggested as a reasonable time period for a vaccine to be shown to be effective and also distributed globally and especially in the United States. Until both of these conditions are met it is difficult to foresee a return of foreign and domestic levels of tourism, with the attendant opening of the border with the U.S.
Beyond Fall 2023 little can be projected with any certainty. An outline is proposed that assumes a world in which COVID has become endemic and effective therapeutics and medical capacity have been established. It is this longer period that also allows for the gradual return of confidence on the part of most Canadians.
Utilizing these three timeframes, the study also provides commentary on the extent to which a shift to remote work practices and the related impacts on the downtown “experience” economy could affect perceptions regarding the urban experience in downtown that has, until recently, distinguished Toronto’s success as a well-rounded urban centre.
4.0 The State of Play at the Start of the 2nd Wave
At the time of writing, with Toronto and the rest of the province at the start of a second wave of infections, that number of office workers downtown on any given day hovers around 40,000 workers.
While preliminary assessments of the first wave and the partial recovery that followed can be identified, it is perhaps more important to note the enduring weaknesses that exist at the start of the 2nd wave.
The First Wave and Partial Recovery
The unprecedented drop in economic activity from mid-March to the end of April created a huge hole in Canada’s economy. Statistics Canada reports a second quarter GDP contraction of 38.7%. xiv The main driver of this huge contraction was the reduction in labour markets as the near total lock-down of the economy saw millions ordered to stay at home to contain the spread of the virus. With the lifting of total lock down restrictions labour markets started to recover in May.
At its trough in April, real GDP was at 82 per cent of February’s (pre-COVID) level, 3 million Canadians were out of work (a 15.6 per cent decline in employment), and total hours worked had plummeted a staggering 28 per cent.xv
Recovery could be seen by mid-summer. Statistics Canada reported that July’s economic activity was at 94 per cent of February levels, and by August, 1.9 million jobs had been recovered, albeit in many cases with reduced hours.
The K Shaped Recovery
It is now commonplace to hear the recovery described as having a K-shape as clear fault lines have emerged. The two spokes of the ‘K’ define two divergent trajectories. The upper spoke applies to the people with good incomes, generally in salaried occupations, who still have jobs.
The lower spoke reflects the downward trend and enduring reduction in total hours worked for lower-income people generally in hourly paid occupations. In addition to reduced hours, most actual job losses are concentrated among these types of employees.
Across the economy, temporary and part-time staff were laid off with an unknown number yet to be recalled. Anecdotal evidence also suggests much freelance work has been postponed. This means no income at all for a significant number of people as more than a third of Canada’s workforce is in something other than a full-time job. The extent of part-time employment is lower in Toronto where 25% of employment tracked by the City is part-time. In the downtown the level of part-time employment is 20%.
For full-time workers there is a clear divide. According to Statistics Canada, 15 per cent of those making $22 per hour or less (basically $38,000 per year) have been laid off or now work less than half of previous hours while the rest of workforce has more or less recovered.xvi This bifurcation of the labour market appears to be lasting as the lower earning jobs are clustered in economic activities that remain in the most challenged.

The ‘Gig’ Economy
It is important to note, however, that these estimates do not include those engaged in the “gig” economy who are reported as “contractors” rather than employees and thus not measured by the City’s annual employment survey.
Statistics Canadaxvii (based on 2016 data) and more recently the Bank of Canadaxviii have sought to define and measure the size of the emerging new form of labour market participation. Statistics Canada defines such workers as “unincorporated and self-employed individuals who enter into contracts with firms or individuals to complete a specific task or work for a specific period of time. The definition includes unincorporated self-employed freelancers and on-demand workers hired for jobs mediated through online platforms such as Uber, TaskRabbit, Upwork, Fiverr and Freelancer.” These workers are not eligible for benefits.
In Toronto, as of 2016, one out of every 10 workers participated in the gig economy for at least some of their income. The number of gig workers increased sharply from 2005 to 2016 with the first surge corresponding to the 2008-09 recession and a second surge taking place in 2012-13 due to the proliferation of online platforms. The Online Labour Index, an economic indicator that provides an online gig economy equivalent of conventional labour market statistics, found on- demand labour through platforms has grown 40 per cent since mid 2016 with Canada’s share up from 4.1 per cent to 9.7 per cent, the fastest growth of all regions examined.xix
The Bank of Canada suggests 18% of the workforce engages in Gig work, with the majority being youth but a non-insignificant also being seniors and those in prime-working age. Work intermediated by web-sites and mobile platforms accounted for 35% of workers but represented the fastest growing portion.
Largely driven by economic slack and deterioration of the “normal” economy, the “gig” economy can be expected to increase proportionally in size as job losses in traditional ventures occur.
Prior to the pandemic the Bank of Canada concluded that including this sector would increase labour force participation rates by 2-3%. In downtown Toronto this would mean 5,000 to 7,500 people but probably higher given the fact that younger workers are over-represented in the gig economy and are a larger share of the downtown population.
Consumer Spending
During the sustained lockdown in the spring of 2020, government programs provided unemployed and under-employed Canadians with sufficient support for basic consumption but were not enough to allow for discretionary spending. In addition, as restrictions were scaled back the combination of actual and perceived health risks encouraged many to avoid in-person shopping wherever possible, underscoring the importance of psychological and perceptual considerations as critical drivers of consumer confidence. Regardless of formal restrictions, these personal decisions will continue to play a determinative role for many consumers, especially when access to retail requires the use of transit which is still viewed with suspicion by many.
This is readily observable. Before COVID, the Eaton Centre was one of North America’s premier retail destinations. While malls in the suburbs have enjoyed a resurgence in activity, stores and services in the Eaton Centre continue to experience drastic reductions in visitation and sales. Stores and restaurants in the PATH, as well as hundreds of street-oriented small businesses that normally depend on office workers and other visitors for their revenues have been particularly badly hit by the pandemic.
As economies started to reopen, gross or aggregate retail activity returned to pre-COVID levels. The persistence of low interest rates and ratcheting up of savings amassed during the lockdown by many could have been expected to sustain consumer spending in the near term, but the onset of the second wave and subsequent lockdown will no doubt undermine this trend.
The persistence of physical distancing measures and border closures will continue to limit growth in the food and accommodation and entertainment industries.
RBC’s COVID Consumer Spending Trackerxx (released at the beginning of November) documented the following reductions in consumer spending:
Year-over-year change in credit and debit spending as of 31 March 2020 was 37.5%. This trend remained negative through June, 2020.
By the Fall, 51% of retail transactions were being conducted remotely (i.e. on-line), an increase from 42% pre-COVID.
Spending in restaurants dropped 68% in March, compared to March, 2019. By October, significant improvement had occurred but spending remained 15% down on a year over year basis.
Spending on entertainment, arts and movies reached a low point of -70.3%, and remain down 23%, year over year.
Small Business Barely Surviving
A survey conducted by the Canadian Federation of Independent Businesses (CFIB)xxi reported
the following responses from members, concluding that enterprises were doing poorly as of November, 2020.
Some 31% remained closed or were not fully open.
Staffing was 58% below normal levels and revenue had declined by 73% from pre-
COVID levels.
Some 17% of businesses were contemplating permanent closure, and 34% indicated
that, based on current revenues, they would only be able to survive one year.
More than half (56%) said that surviving the second wave will be a challenge.
NGOs/Charities at Risk
Another sector of the economy showing signs of strain as a result of impacts caused by the pandemic is the non-profit (also known as non-governmental organizations or NGOs) and charities. According to a survey conducted in June 2020xxii, federal and provincial programs have not provided this sector with sufficient levels of support to help NGOs navigate the COVID crisis or prepare them for recovery.
Although 40% of NGOs/charities report an increase in demand for their services, revenue
through grants and donations has fallen. With an average decline of more than $120,000 annually, estimated losses will reach approximately $90M.
Thirty percent of NGOs have had to lay off staff, totalling about 3,000 jobs. Some 20% report that, without specific financial supports, they will close permanently within six months.
In Toronto nearly 50% of NGOs indicate that will only be able to remain operational for one year under current conditions. Although more than a third of these organizations are deemed to be ‘essential services,’ 29% of NGOs have had to lay off staff. These negative trends are likely to have a disproportionate impact on Downtown Toronto, which is home to a large number of NGOs, employing more than 18,800 people.
Tourism on Hold
Before COVID, Toronto received more than 25 million domestic and international visitors annually, contributing billions to local hotels, restaurants, bars, theatres, sports and other entertainment venues, the majority of which are located in downtown. This is a sector
of Toronto's economy that supports 70,000 jobs and added 10,000 new jobs over the past 10 years.xxiii
According to Destination Canadaxxiv, as of May 31, estimated overnight arrivals had declined 99 per cent, 770,000 hospitality jobs had been lost nation-wide, and the industry’s normal revenues had incurred ongoing losses of 80 to 90 per cent. Tourism, hospitality, and sports — usually major draws and income earners for the city — have been devastated. Expectations of recovery cannot be credible until a vaccine that is globally distributed and effective is in place.
Transit Broken
Transit in the Toronto relies upon the fare box to an extent that far exceeds norms in other jurisdictions. The collapse in transit ridership has caused municipal transit operating budgets to crater. Prior to the pandemic, almost 117,000 commuters from the regions around Toronto used transit, mostly GO, to access Torontoxxv, with many of these going to downtown destinations near the Union Station terminus of the GO rail service. This ridership has not yet returned. Metrolinx reportsxxvi that ridership for April through September was down by 92.4%.
Within Toronto, the subway (and to a lesser extent the surface streetcar routes) has traditionally been the main transit delivery source for downtown. To date total TTC ridership has returned to 35% to 40% of its pre-COVID levels. This, however, has largely been focused on surface bus routes. Subway usage remains historically depressed.
Emergence of Reputational Challenges
Some areas of downtown are reporting increases in petty crime and calls to 911. BIA managers have expressed concerns for the City’s reputation as a safe, clean place to shop, live and visit. Greater indicators of inequality and an emergent erosion of social cohesion are seen by many as people experiencing homelessness and those in precarious economic situations are more prominent.
In many respects what has always been present is now more visible as the masses of people – workers, students and tourists – who once dominated city streets day and night are now no longer present. In their absence, the most marginalized remain.
A greater reluctance to go downtown at night is an immediate early indicator of long-term reputational risk to the downtown.
Early Signs of Softening Rental and Condo Market
New third quarter numbers from the Toronto Real Estate Board (TREB)xxvii show there are now 113 per cent more units available for lease on the market than in the third quarter of last year, when there were 16,350 units up for rent. URBANATIONxxviii, which focuses on condominium activity, reports a 215% year-over-year increase in the number of condos listed for rent in downtown Toronto.
There are now nearly 35,000 units available in the Greater Toronto Area. Smaller 500-square- foot units are also getting harder to rent and average rent are falling. TREB's numbers show that this time last year, the average one-bedroom was going for $2,262, whereas now they're renting for $2,012. (e.g. 11% drop)
According to website rentals.ca, the average asking rent for a one-bedroom in the city was $1,922 in October — a 2.3 per cent decline from September and a 17.3 per cent plunge compared to the same month last year.
5.0 Conclusions
5.1 Part 1: What is the risk to jobs?
Statistics Canada data shows the different impact lockdown measures had on different sectors of the economy in the spring of 2020.xxix As shown below, the different composition of the downtown economy and that of the rest of the City is stark with the annualized GDP reduction outside of downtown being almost double that in the downtown.

The data also highlights the economic activities and sectors that are most at risk, adding quantitative evidence to support many anecdotal observations. The data also supports the calls for assistance made by various advocates and industry associations.
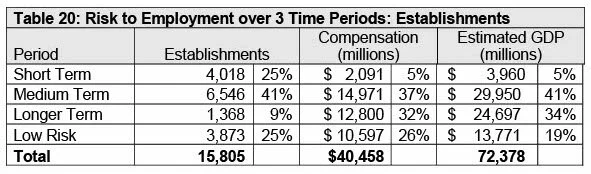
SRRA’s analysis concludes that the risk to downtown economic activities can be best understood as a series of risks that will increase or manifest themselves over time. When projecting on-going possible impacts and risks SRRA adopts three time periods:
Short-term extending through March 2021;
Medium-term extending through to Fall, 2023, and
Longer-term, extending beyond 2023.
As shown below, 25% of total employment in the downtown is in activities that have a low risk of impact, regardless of time frame. These activities also account for 33% of part-time employment, so it is not unreasonable to assume that this may increase over time.
At the other extreme, however, are jobs such as those in the tourism and hospitality sector, which have already been undermined and will be further impacted immediately if the City is forced to endure an extensive second lockdown. If the border remains closed and mobility continues to be restricted, there is a risk that many of these will disappear.

Policy choices made by the federal and provincial governments, the U.S. and internationally will have a significant effect on short and medium-term economic impacts. As presently configured, government programs are sufficient to support basic consumption by individuals and provide relief for recurring expenses for a range of businesses. These programs will provide a floor to demand and will help avoid the erosion of demand over the short-term from now through to Spring, 2021 (the end of the fiscal year for both levels of government). More concerning, however, is that these supports will not be sufficient to sustain demand over the medium or even the longer term. Unlike previous recessions, the COVID recession is the result of ‘demand suppression,’ or, for some industries, ‘demand elimination.’ For the BIAs and business leaders this is an entirely new type of challenge without precedent.
SRRA suggests that the medium-term is the critical period for the economy.
Extending for three years, this is the period that will determine if effective medical advances can be implemented (both vaccines to prevent infection and therapeutics to treat COVID-related illness), which will allow for the gradual return to previous levels of individual consumer confidence (both in their safety and their economic security).
It is this period that will be most critical for civic and business leaders as they address and mitigate the emergent social challenges. For the Downtown Yonge BIA and the Entertainment BIA in particular the reputational risk is critical. These are the two major “destination marketing neighbourhoods” and it can be expected that they will see a longer period of recovery as it wil take time to build the community and consumer confidence to come back into the neighbourhood. The social inequity and the challenges that have long existed have become starker and only increased during COVID and these will remain well into a recovery and rebuild phase for downtown.
This is also the period during which a return to open borders for travel and trade can be assumed to occur in the best-case scenarios. Without this, a full return to the levels of demand found prior to COVID cannot be expected.
The longer-term is the most speculative. In the best-case scenario, the “new normal” is much like the pre-COVID reality. It is also plausible, however, that the longer-term could be one that results in follow-on economic shocks triggered by the COVID experience. Risks at the macro economic level, outlined below, could impact credit markets, creating disruptions comparable to those experienced in the 2008 financial crisis. Less extreme outcomes which nonetheless necessitate a new configuration of activity can and should be expected.

Almost $4 billion in GDP and almost 81,000 jobs have either been effectively shut down already or are poorly suited to survive another extended lock down and/or a complete closing of the border. Although these activities only account for 5.5% of the downtown’s total GDP they account for more than 25% of the establishments downtown and almost 15% of all jobs.
These activities also form the very core of the “urban experience” economy that is central to the ‘reputational attractiveness’ of the City. As addressed below, many of the amenities involved are central to the location decisions of residents. The erosion of these can be seen as a risk that would lead to more and more residents choosing to relocate.
Assuming on-going government direct supports for businesses and supports sufficient to maintain demand by consumers for basic and essential goods (clothing, furniture and general items) it can be anticipated that approximately 40% of jobs and GDP in the downtown can survive with moderate impacts.
Even among these sectors, however, significant risks to specific activities can be expected. The post-secondary sector relies significantly on revenue from international students. If, as expected, border restrictions remain in place over the medium-term it is inevitable that the downtown universities, most especially the University of Toronto, will be impacted.
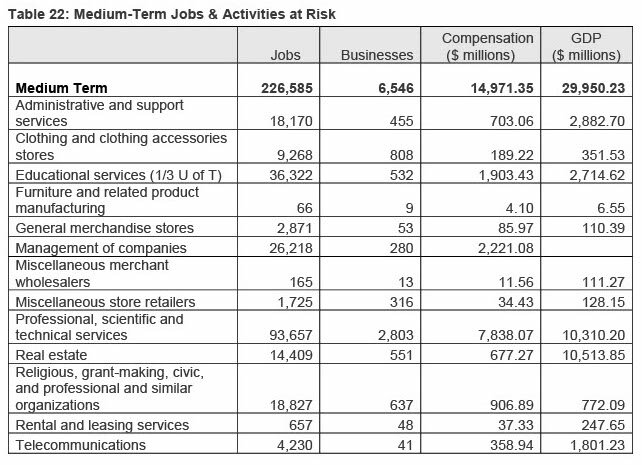
The charitable and non-profit sector is also in a unique risk position as noted in Section 4. Generalized demand reduction can also be expected to impact telecom and ultimately rental and real estate activity.
Impacts on those activities that support the larger economy (administrative, management and professional services) can be expected to assume new configurations. If the period of remote working extends for a sustained period of time it is inevitable that changes made on a temporary basis may become permanent. Clustered in “white collar” activities it is unlikely that job losses will be permanent but it is likely that the re-location of a portion of these away from the downtown will occur.

Activities at longer-term risk, identified in the table above, have the best potential to be insulated from COVID restrictions. The difference is the allowance for the unknown. In the event of long- term structural changes to the economy or a second financial crisis or COVID becoming unmanageable, we conclude that these economic activities would face significant challenges. The likelihood is by definition unknowable but it is prudent to quantify the risk profile of a “worst case” scenario.
5.2 Part 2: What is the risk for the downtown as a residential community?
As noted in Section 4, vacancy rates for downtown rentals are beginning to increase and rents are dropping.xxx Anecdotal evidence and intuitive observation suggest the lack of jobs and the collapse of downtown social life opportunities, especially for low wage earners, in the downtown residential markets is driving a short-term downturn in the rental markets.
Media reports on changes in rental conditions away from small, functional “boxes in the sky” that served primarily as a sleeping location for those who spent their waking hours working or taking advantage of the lifestyle options afforded by the previously vibrant downtown may, in fact, be supported by the evidence.
The already softening condo market has seen apartment listings increase 45 per cent year over year. Units under construction will add over 45,000 units over the next 18 months. Anecdotal evidence from realtors and brokers suggests that pre-closing assignment sales have doubled over levels normally seen suggesting concern on the part of some investors.xxxi Sales, however, continue, making it premature to suggest any fundamental change in the market is either imminent or inevitable.
As detailed below, the risk to the downtown rental market is driven both by economic considerations and, perhaps more importantly, by lifestyle choices reflective of the unique demographics of downtown residents.
As shown by demographic statistics, the downtown is in many respects very different from the rest of Toronto.
Downtown residents are younger, with 42% between the ages of 20 and 34, compared to less than 23% in the rest of the City.
As a result, 43% of households are headed by someone under 35, compared to 17.5% of households in the rest of the City.
Another significant difference is that the percentage of single person households in the downtown is much higher than in the rest of the City (50% versus 30%).
Almost 65% of downtown households are either single (i.e. not married) or are living with room mates, almost double the equivalent percentage in the rest of the City.
Significantly, almost two thirds of downtown residents are renters. compared to less than 45% in the rest of the City.
It is also worth noting that downtown residents tend to be more mobile, with over 63% changing homes in a five-year period compared to less than 40% in the rest of the City.

Taken together, these demographic realities show that the downtown population is more susceptible to change than the rest of the City. Single person households are single earner households with fewer resources to fall back upon in the event of work disruption.
Many residents aged 15-24 as well as individuals in non-family households are assumed to be students, SRRA estimates this number to be approximately 30,000, 20% of all downtown households. How these people will act in a world of on-line schooling without the attractions and amenities of downtown is unknown.
As shown in Table 14 of section 3, younger workers and especially younger men are the least likely to hold jobs that can be performed remotely. This fact, combined with the profile of jobs held by downtown residents shown below, adds economic considerations to the demographic issues raised above as reasons why downtown residents may be motivated to relocate out of the downtown.

In total, 50,288 downtown residents hold jobs in economic activities that can be considered to be at high risk to being impacted by COVID-related restrictions. This accounts for almost 28% of the employed downtown labour force.
Moreover, an unknown number of the nearly 15,000 employed in the education sector will be graduate students and other students employed in on-campus activities.
A further economic indicator of the risk to downtown residents is household income. As shown in section 4, the slow recovery has seen a clear K shape with incomes of approximately $40,000 per year showing the slowest recovery and the greatest level of on-going reduction in hours worked. As shown below, almost 33% of downtown households have incomes under $40,000. These 50,000 households are “at risk” the longer COVID restrictions continue.

5.3 Part 3: What is the risk for government revenues?
City Finances
Of the three orders of government the City confronts the most difficult path forward as, unlike the provincial and federal governments, it is not able to run operating deficits or finance current operations through the issuance of debt. Its revenue base, however, is not as exposed to economic downturn as the tax base shared by the federal and provincial governments which will see declining sales tax and income tax revenues that are not subject to City taxation.
The City’s primary own-source revenue is from the property tax base (including land transfer taxes) and fees for City provided services such as transit fares and City Parking revenues. In a report dated October 2020xxxii, the City Manager reported that “It is well understood that the financial pressures caused by COVID-19 will exist into at least 2021.
City staff are estimating a preliminary, opening pressure for the 2021 Operating Budget of $1.5 billion” which include decreased revenues and increased costs.
In In the downtown most property tax is largely commercial in nature. Although downtown occupies less than three percent of the City’s land area, the assessed value of real estate accounts for about 25% of all revenues from property taxxxxiii. While some delinquencies can be expected the fact that most downtown commercial properties, as measured by square footage, are large office building and centres that are predominantly owned directly or through subsidiaries by large institutional investors primarily in the form of large pension funds. With stable portfolios and very long investment horizons, these are in many respects the ideal owners for commercial real estate during a pandemic. While individual tenants, especially in retail and food, will be seriously challenged, the ultimate responsibility for the payment of property taxes will continue to fall on large institutional owners that are capable of paying.
The situation for hotels presents a comparable situation as least where the larger hotels are concerned as most are part of established and in many cases global operations.
The City has for many years benefitted from significant revenue from the land transfer tax. This tax base may see significant volatility but real estate sales as a whole have rebounded following the period of total shut down. It is also equally true that COVID-driven sales of existing condos in particular may increase. Insulating itself from this unpredictable tax base has been a policy imperative advocated by City managers for many years and this will be more so the case as the City navigates through the uncertainty of the next few years.
The biggest fiscal challenge confronting the City is transit fares. TTC fares have been budgeted at approximately $1.2 billion in recent years. At present, ridership remains compromised and well below 40% of pre-COVID levels. It is prudent for the foreseeable future to budget on the assumption that fare revenues will remain significantly compromised. Assuming a 50% reduction creates a $600 million challenge.
Of all the areas that City policy can address, transit revenue enhancement should be among the top priorities and focussed on diversifying the revenue streams available to support transit operations.
Provincial Finances
The Province collects property taxes to support education. As with municipal property tax revenue, this tax base is significantly insulated from COVID related risk due to the significant ownership of commercial real estate by large Pension Funds. The Province’s share of land transfer tax is also subject to the same observations about municipal land transfer tax.
As noted in section 5.1, the assumed worst case short-term impact on Toronto’s downtown is a reduction in GDP of $7.8 billion assuming the measured impact at the height of the Spring 2020 lockdown was annualized.
Tax loss can be estimated as a share of GDP. In Ontario taxes represent approximately 14.25% of GDP. Assuming a $7.8 billion GDP reduction the assumed Provincial revenue loss would be approximately $1.1 billion in foregone tax revenues from all sources.
As with transit in Toronto, the Province faces a significant and enduring challenge as a result of reduced Metrolinx fare revenues. Assuming a short to medium term reduction in ridership of 80% it is prudent to assume a fare loss challenge of at least $450 million.
Federal Finances
Federal revenues are generally 20.7% of GDP. Assuming a $7.8 billion GDP reduction in downtown, the assumed Federal revenue loss would be approximately $1.6 billion in foregone tax revenues from all sources.
5.4 Part 4: Macro Economic Risks & Conclusion
Macro Economic Risks
There are three major macro economic variables that are beyond the control of Canadian decision makers. It is important that these be acknowledged as “known unknowns” but it is equally important that such an acknowledgement not be taken as concluding that worst case outcomes are either inevitable or indeed probable. These risks are:
Residential Real estate
Global Commercial Real Estate
Immigration and International Travel
Residential Real Estate
Some observers have noted a tightening of financing qualification conditions with down payment requirements increasing to 35% from 20% and banks moving to lower inclusion rates for rental income down to 50% from 80%.xxxiv The risk that these changes may trigger reduced investment due to reduced access to financing is of concern especially to small investors. Others have suggested that reduced immigration flows and a flight from downtown by residents mean Toronto’s downtown housing market has the biggest bubble risk in North America. xxxv
Such worries, however, overlook the fundamental soundness of the downtown housing market. While adjustments in supply and demand will have short-term impacts there is no reason to conclude that such impacts will be permanent.
Global Commercial Real Estate
Internationally, observers in the US and UK have flagged concern about commercial real estate defaults and the size of such financing now bundled into investments held by large investors.
The integrated nature of global financial markets means the Financial Services industry concentrated in Toronto could be exposed to international risk as was the case with the 2008 financial crisis.
Immigration and International Travel
The timing and scale of an eventual return to pre-COVID patterns of immigration and travel is dependant upon the success of other nations in reducing and ultimately controlling COVID. This is beyond the control of Canadian actors. The importance, however, of a such flows to the downtown economy cannot be understated.
Conclusion
This report has outlined and sought to quantify the economic costs for the downtown created by the COVID pandemic. As detailed herein these costs are significant and the risks are especially shouldered by the lowest paid and small businesses. At a human level there has been and will be real pain for far too many.
It is equally true that the downtown economy’s structure and diversified nature mean it is very well situated to not only survive but thrive. It is important to note that the challenges faced in Toronto are the same as those faced by our international competitors. Managing recovery will see changes at the individual level but the long-term prospects for Toronto retail, tourism and other sectors challenged in the short term remains strong.
All of the factors that made downtown Toronto a desirable place to live and work prior to COVID will continue to be present as we manage COVID related challenges and long after COVID is either eliminated or managed as an endemic challenge within acceptable Public Health parameters.
Toronto’s downtown will continue to be diverse, attractive to new-comers and provide a concentration of opportunities in finance, health, post-secondary education, technology and culture.
The economic drivers of the post-industrial economy are the drivers of the Toronto downtown economy. The fundamentals that have made Toronto’s downtown a success have not been changed.
6.0 APPENDIX - BIA Specific Data Tables
6.1 Downtown BIAs by Major Economic Activity – Jobs
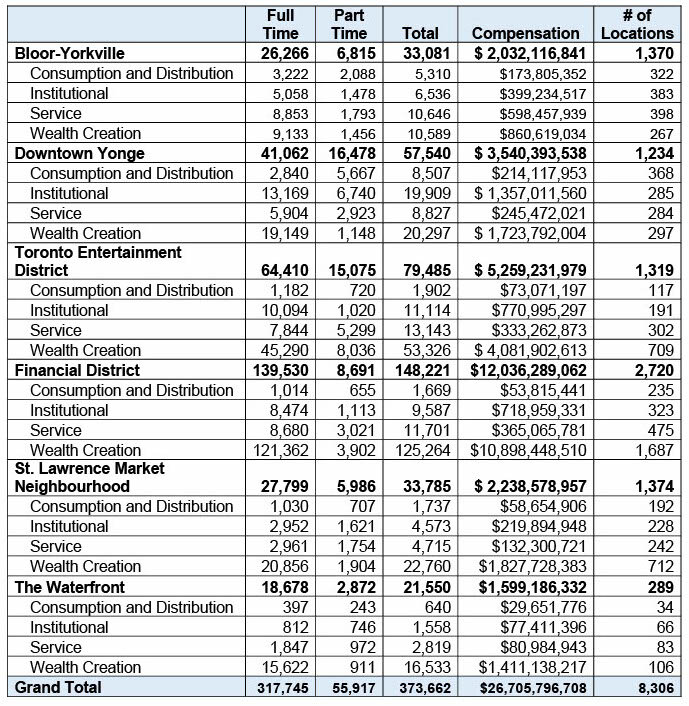
6.2 Downtown BIAs by Ability to Work Remotely

6.3 Downtown BIAs by Time Risk

6.4 Time Risk by Downtown BIA

6.5 BIAs by Time Risk & Activity Bloor Yorkville

BIAs by Time Risk & Activity Downtown Yonge

BIAs by Time Risk & Activity Toronto Entertainment District

Downtown BIAs by Time Risk & Activity Financial District

Downtown BIAs by Time Risk & Activity St. Lawrence Market Neighbourhood

Downtown BIAs by Time Risk & Activity Waterfront

7.0 Endnotes


Sponsors of this Study